Key Notes
- Whales have purchased a whopping 130 million OM tokens in just 20 days.
- Crypto analyst Matt May forecasted that $10+ is just the beginning for Mantra.
- OM is down 20% in the past month but has broken out of a bullish triangle pattern.
Mantra OM $6.57 24h volatility: 3.5% Market cap: $6.48 B Vol. 24h: $76.04 M could possibly be gearing up for a price surge with analysts pointing to strong bullish momentum.
According to crypto analyst Ali Martinez, whales have accumulated over 130 million OM in the past 20 days. This substantial buying activity signals confidence among large investors, often a precursor to massive price increases.
Mantra to $10?
Crypto analyst Matt May has called Mantra an RWA (Real World Asset) powerhouse, predicting a price target of $10+ in the near future.
His analysis is based on a breakout from a symmetrical triangle pattern, signaling a bullish reversal for Mantra (OM/USDT). The chart shared by May highlights key price levels and technical formations, seconding the bullish outlook.
The price action initially formed a symmetrical triangle pattern with lower highs and higher lows, indicating a consolidation phase. The breakout, once OM hit the triangle resistance, confirmed a trend reversal for the altcoin.
The height of the triangle pattern (from lowest point to resistance) is measured and projected from the breakout point to determine the price target. Based on the chart structure, the breakout target aligns around $8.00–$8.20.
At press time, the cryptocurrency trades at $6.81, up 1.55% in the past 24 hours but is down 20% in the past 30 days, CoinMarketCap data confirms.
It is quite possible to see OM break the all-time high at $9.04, which would mean a 25% surge from current prices.
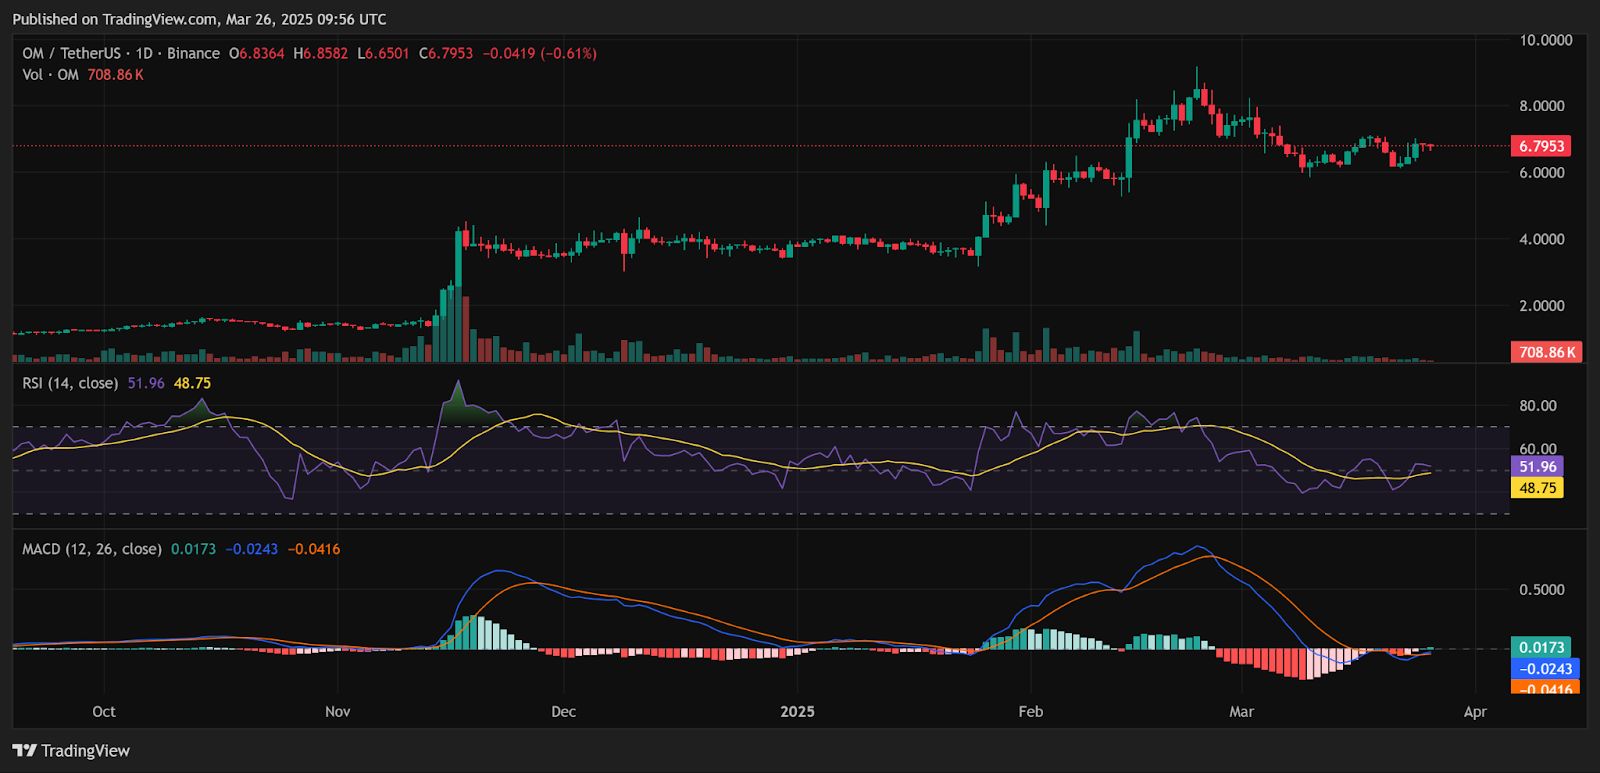
OM Price Analysis
The RSI (Relative Strength Index) indicates whether a crypto asset is overbought or oversold. In Mantra’s case, the RSI reads 52, suggesting bullish momentum but still not in the overbought territory, meaning more room for growth.
The price is currently testing the upper Bollinger Band, a sign of increased volatility. If this resistance at $7.1 is broken, a breakout towards the $10 price tag can be expected.
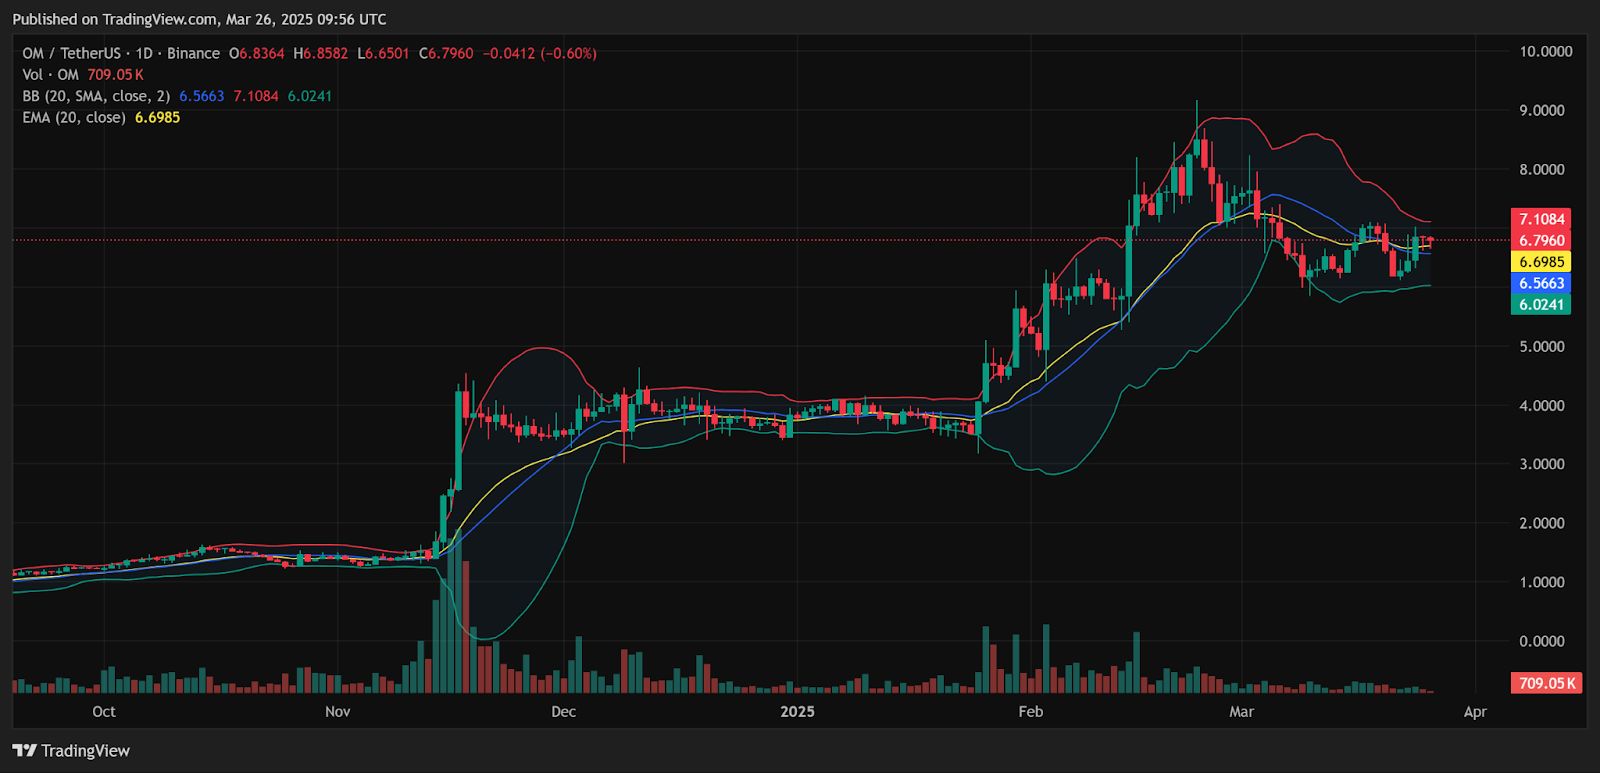
More importantly, OM trades above the 20-Day Exponential Moving Average (EMA) which is a classic sign of bullish continuation. If this level continues to hold as support, higher prices can be likely.
The key support level lies near $0.45-$0.50, while resistance is observed around $0.80-$1.00. Breaking above this resistance could set the stage for a rally toward the $10 target.
nextDisclaimer: Coinspeaker is committed to providing unbiased and transparent reporting. This article aims to deliver accurate and timely information but should not be taken as financial or investment advice. Since market conditions can change rapidly, we encourage you to verify information on your own and consult with a professional before making any decisions based on this content.