Understanding Crypto Market Cycles Through Lending MetricsIntroductionWhat is DeFi Lending and Borrowing?Framework 1: The "Value of Money" MetricFram

Introduction
The cryptocurrency market moves in cycles of expansion and contraction. While many traders focus on price action or social sentiment, lending and borrowing metrics provide unique insights into market conditions. These metrics can help identify market extremes - both the overheated periods where caution is needed and the cooling periods that might signal buying opportunities.
This article explains key frameworks for analyzing crypto market conditions through decentralized finance (DeFi) lending data. Below, we'll look at how to spot market tops and bottoms using lending rates, debt levels, and liquidation events.
What is DeFi Lending and Borrowing?
DeFi lending and borrowing platforms allow users to lend and borrow digital assets without traditional financial intermediaries like banks. They use smart contracts - self-executing code on blockchains - to automate lending processes and enforce agreement terms between parties.
On these platforms:
- Lenders deposit digital assets and earn interest
- Borrowers use assets as collateral to get loans in stablecoins or other cryptocurrencies
offer more flexibility, accessibility, and transparency than traditional finance. However, they come with risks such as smart contract vulnerabilities, market volatility, and potential liquidations.
Framework 1:
The Concept
The first framework examines interest rates on lending platforms like Aave and Compound. These rates reflect supply and demand for capital in crypto markets.
When borrowing demand increases, interest rates rise. Extreme interest rate spikes often signal market tops, while flat or low rates may indicate market bottoms.
This framework reflects an analysis of the behaviour of market participants, where the determination of the value of money is a direct expression of general market sentiment.
Key Indicators
- Stable Coin Supply Rate: The amount of interest earned when depositing stablecoins like USDC or DAI
- Borrowing Rate: The interest paid when borrowing these assets
- Supply/Borrow Ratio: The relationship between available capital and borrowed amounts
How to Interpret the Data
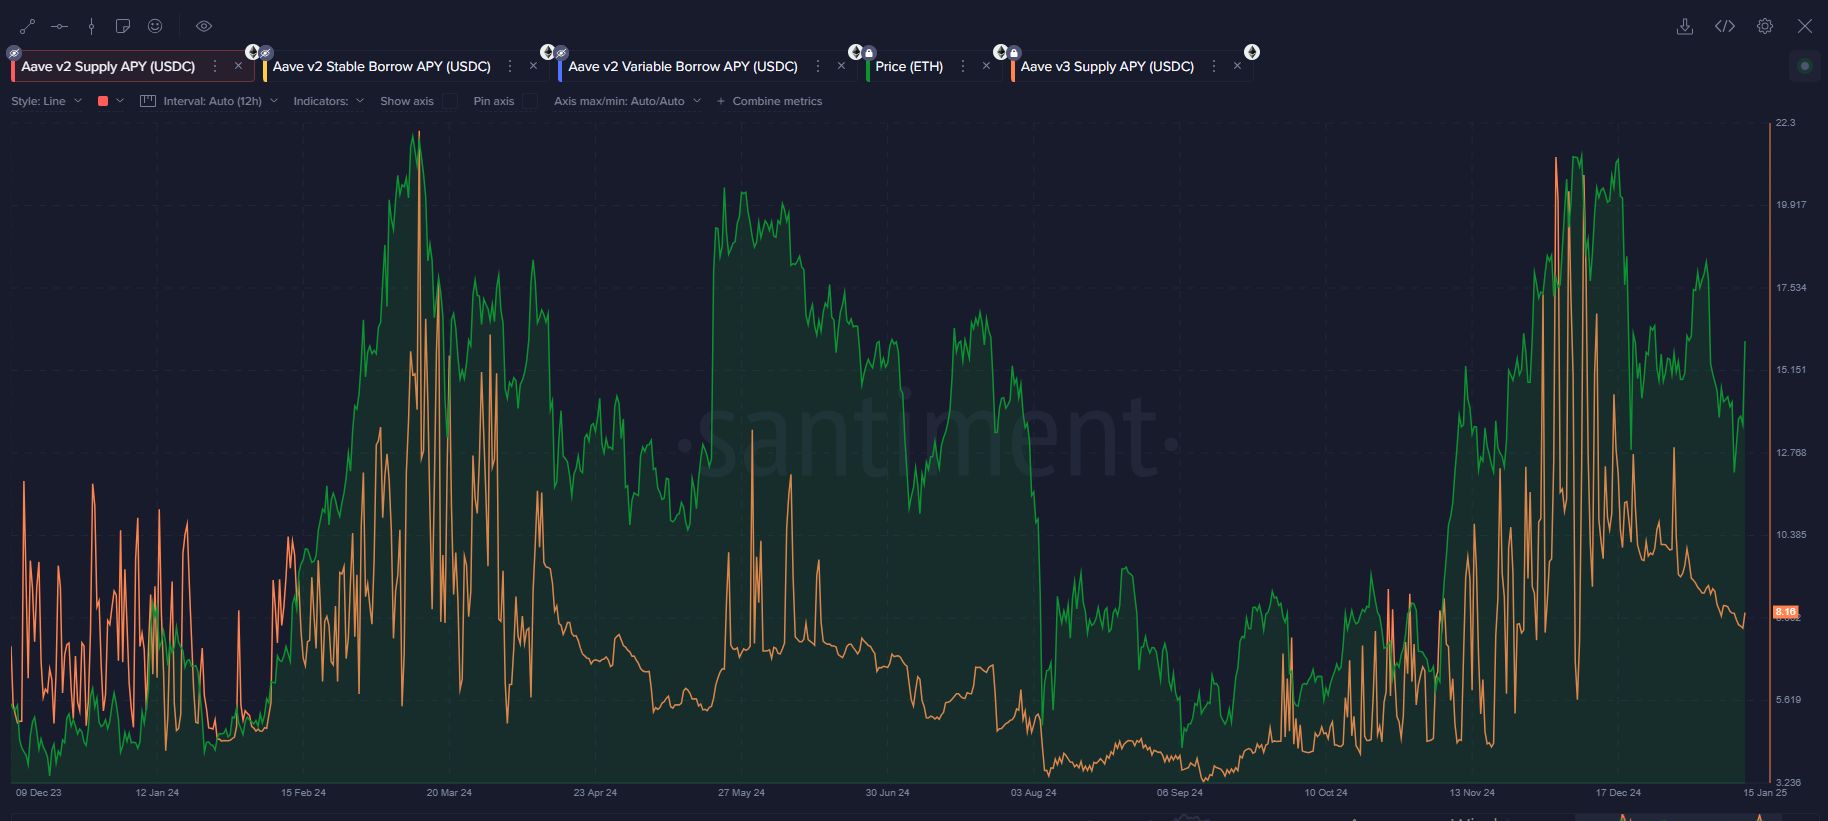
- Market Top Signals: Interest rates above 10-15% suggest overheated conditions where borrowers are willing to pay high costs to gain leverage
- Market Cooling: Falling interest rates indicate decreasing demand for leverage
- Market Bottom Signals: Sustained low, flat rates (3-4%) for several weeks suggest reduced speculation and possible bottoming conditions
The most reliable signal isn't just high rates but when rates rise quickly and substantially above baseline levels. Similarly, the bottoming process typically isn't complete until rates remain flat for 2-4 weeks.
For determining 'value for money' you can use this ready-to-use dashboard:
Framework 2:
The Concept
Liquidations occur when borrowers' collateral value falls below required thresholds. These forced collateral sales create market pressure and often signal capitulation events.
Large liquidation spikes combined with decreasing total debt can mark potential market bottoms.
Key Indicators
- Total Liquidations: The dollar value of positions forcibly closed
- Total Debt Changes: Increases or decreases in the total borrowed amount
- Repayments: Voluntary debt reduction by borrowers (distinct from liquidations)
Types of Leveraged Positions
Most liquidations come from two types of positions:
- Long Leverage: Borrowing stablecoins against crypto assets to buy more crypto
- Short Positions: Borrowing crypto against stablecoins to sell and bet on price decreases
Long liquidations are more common and typically occur during market drops, while short liquidations happen during sharp upward moves.
How to Interpret the Data
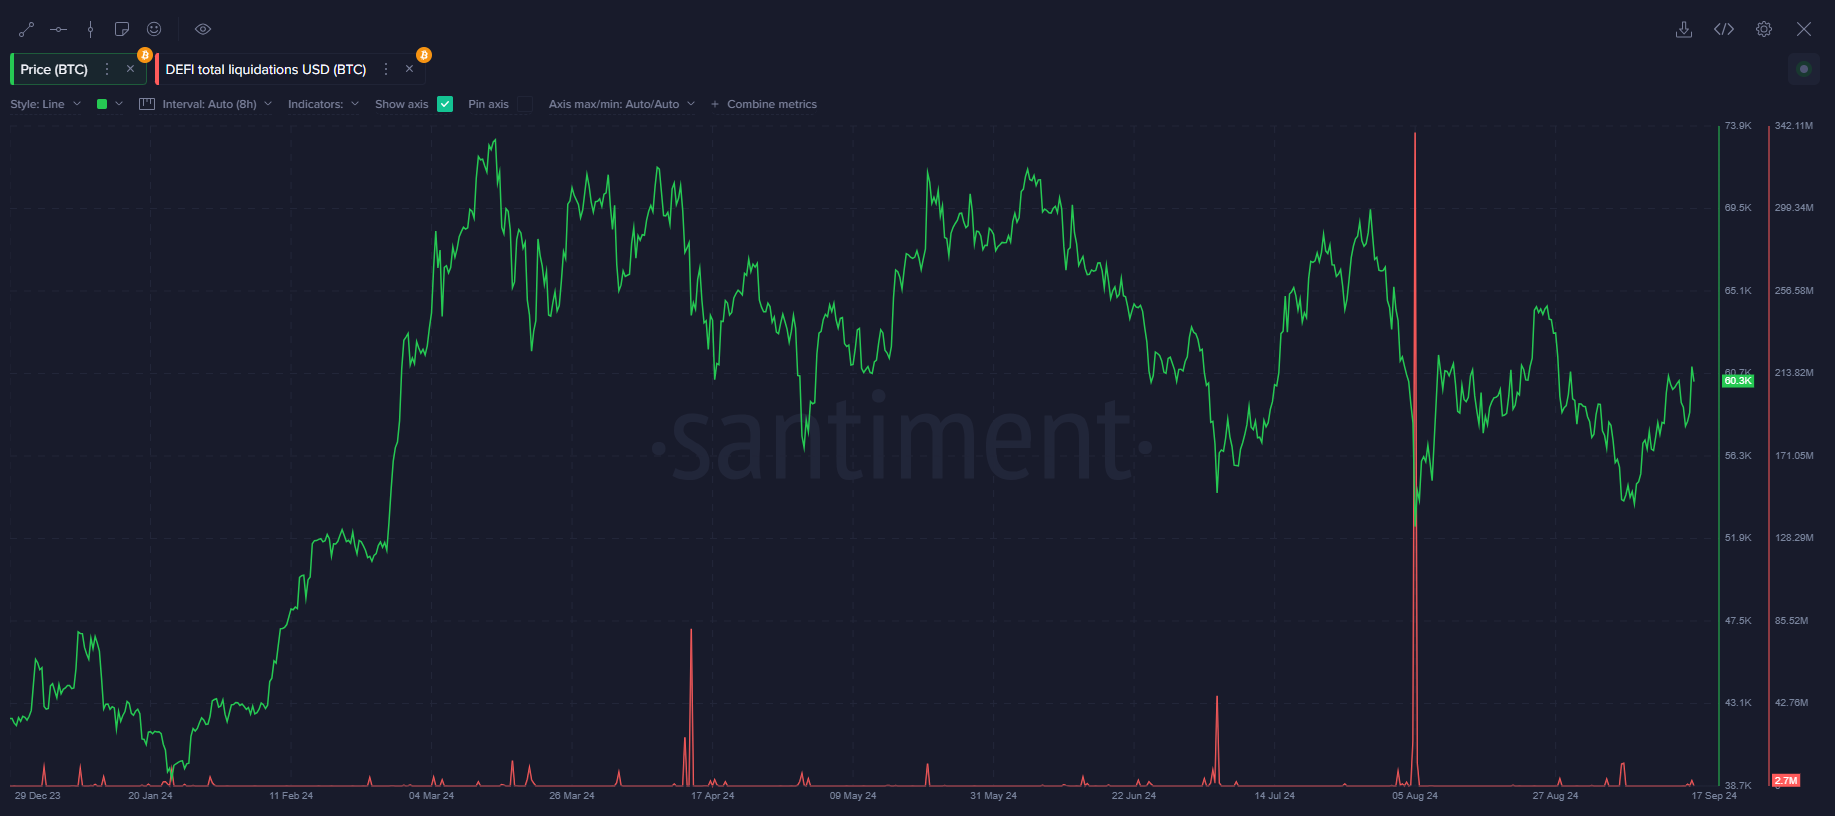
- Large Liquidation Events: Significant liquidation spikes often mark local bottoms
- Concurrent Debt Reduction: When liquidations coincide with total debt decreases, the signal strengthens
- Support Levels: Price levels where major liquidations occur often become support in ranging markets
For optimal entry points, look for the combination of large liquidations AND significant debt reduction. The largest liquidation events of the past cycle (August 2024) preceded substantial rallies.
To monitor liquidations you can use this ready-to-use dashboard:
Complementary Metrics
These additional metrics enhance the analysis:
1. Total Open Interest
Total measures the total value of outstanding futures contracts. High open interest during price increases often signals excessive leverage and impending corrections.
2. Funding Rates
show the premium between perpetual futures and spot prices:
- Positive rates: Longs pay shorts (bullish sentiment)
- Negative rates: Shorts pay longs (bearish sentiment)
Negative funding rates often precede bounces as short liquidations can fuel upward momentum.
Practical Application Framework
To apply these insights effectively:
1. Monitor Heat Signals:
- Track stable coin lending rates for signs of market overheating (>10%)
- Watch for extreme borrowing demand spikes
2. Identify Cooling Conditions:
- Look for declining interest rates
- Wait for rates to flatten for 2-4 weeks
3. Confirm Capitulation:
- Large liquidation events
- Significant debt reduction following liquidations
- Negative funding rates (shorts paying longs)
4. Adjust Strategy Based on Market Phase:
- In strong uptrends: Consider adding positions after liquidation events
- In choppy ranges: Wait for price to hold support at liquidation levels before entering
Conclusion
Lending and borrowing metrics offer powerful insights into market psychology and leverage conditions. By tracking interest rates, debt levels, and liquidation events, traders can identify potential market extremes more effectively than through price action alone.
These metrics help answer key questions:
- Is market demand for leverage rational or irrational?
- Have we seen enough pain to mark a potential bottom?
- Is the market cooling enough to consider re-entry?
While no indicators are perfect, this lending-focused framework provides additional perspective beyond traditional technical analysis, helping traders make more informed decisions throughout market cycles.
Disclaimer: The content of this article solely reflects the author's opinion and does not represent the platform in any capacity. This article is not intended to serve as a reference for making investment decisions.
You may also like
Unraveling Bitcoin’s Stability Amidst $359.7M Liquidations: The How and Why
Unpacking the Factors Behind Bitcoin's Resilient Conduct in the Face of a Massive Long Liquidation Event

Viral Fame, Volatile Finance: SEC Closes Book on ‘Hawk Tuah’ Crypto Drama
FSCA Warns South African Investors to Steer Clear of Unlicensed Crypto Firms
T-Mobile Hit With $33M SIM Swap Award Over Crypto Theft