Deciphering Crypto Product Customer Acquisition Cost: How "Precious" Are Crypto Users Really?

The customer acquisition cost of a single wallet is closely tied to the market cycle, geographical region, and the effectiveness of marketing campaigns.
Original Article Title: The Numbers Behind Cost Per Wallet
Original Article Author: Asaf Nadler, COO of Addressable
Original Article Translation: Luffy, Foresight News
Approximately a month ago, I published an article on "Cost Per Wallet" (CPW). This unique Web3 growth quantification metric measures the cost of acquiring website visitors who install a wallet on their browser.
The article received a strong response. Marketers, advertising agencies, and project founders joined the discussion, sharing their thoughts, challenges, and key data points. One question stood out prominently among the numerous direct messages and replies:
"Tell me about the cost - what is the situation in a specific time, region, and platform? Will success or failure change the way cost is calculated?"
This article will answer this question with detailed data. I analyzed over 200 programmatic advertising campaigns launched by more than 70 advertisers on the Addressable platform in 2024, targeting over 1.5 million users globally. The aim was to study CPW in different market cycles, regions, campaign executions, and segmented audiences.
2024 CPW Trends: How Does the Market Cycle Affect Costs?
Bull and Bear Cycles: 2024 experienced two drastically different market cycles. At the beginning of the year, the market performed strongly, with the first quarter in a bull market, seeing a 21% increase in total cryptocurrency market value compared to the previous quarter, reaching $1.7 trillion. However, this momentum reversed in the second quarter, with a 12% decrease quarter-over-quarter, further deteriorating by 27% in the third quarter. By the fourth quarter, the market rebounded strongly, with a 109% increase quarter-over-quarter, entering another bull market phase. These market changes naturally impacted CPW, but the impact was not uniform.
The fluctuation of CPW in different market cycles reveals not only the expected pattern of lower costs in a bull market and higher costs in a bear market. It also highlights the sensitivity of different regions to market fluctuations, the importance of timing, and the strategic advantage of targeting markets with strong resilience against downturns.
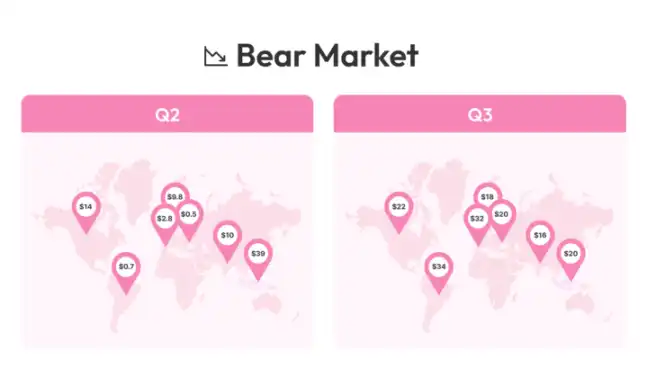
Developed Markets: Developed markets like the US and Western Europe often offer more predictable CPW during a bull market phase but with significant elasticity. In the first quarter, the CPW in the US remained at $5.87, but as the market sentiment shifted in the third quarter, costs skyrocketed almost fourfold to $22.81. Western Europe showed a similar pattern, with even more significant fluctuations, surging from $1.18 to $32.79. While these markets can provide scale and quality during a bull market, when market sentiment turns bearish, costs increase significantly, reducing their sustainability during market downturns.
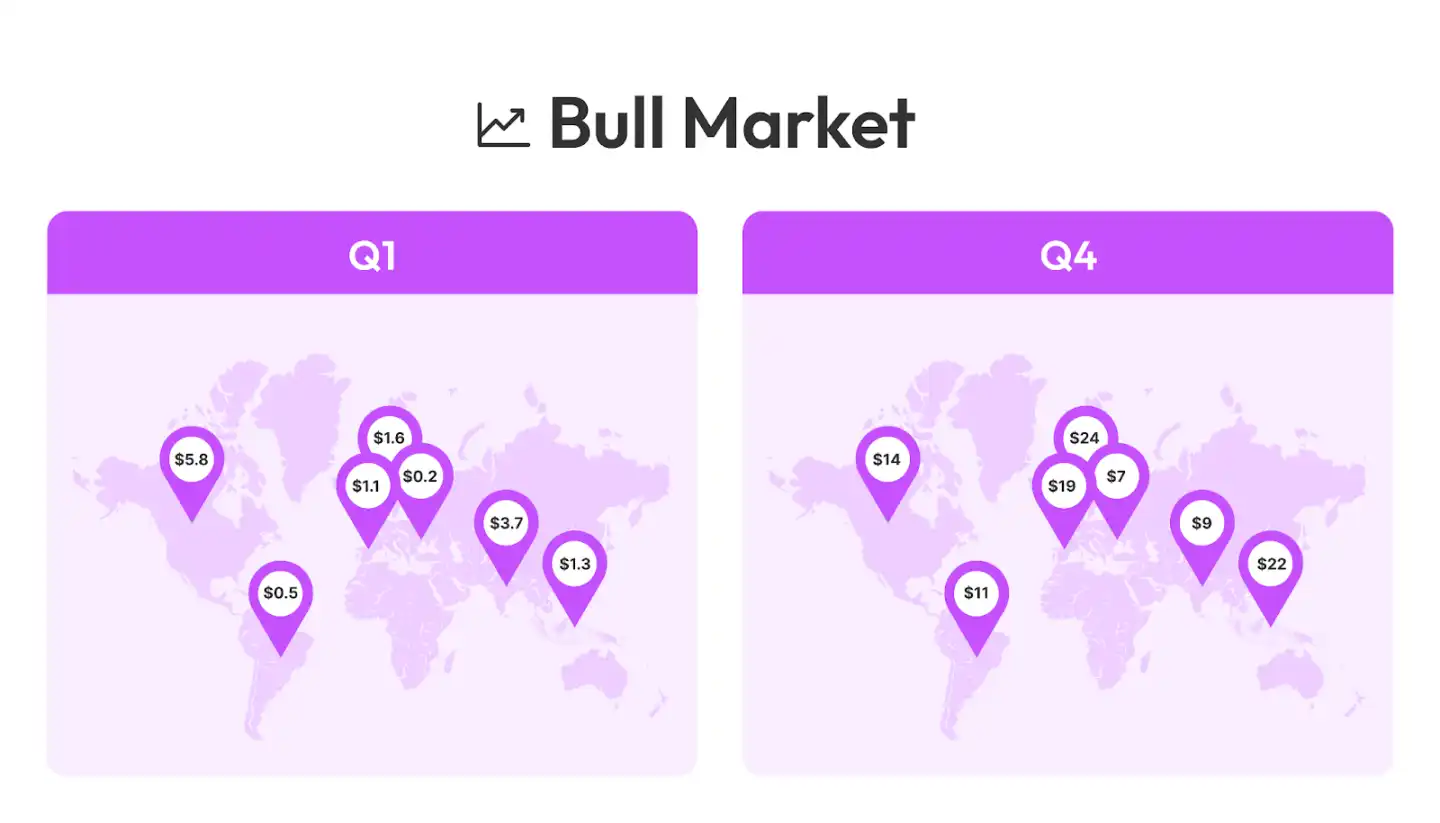
Emerging Markets: Exhibit different risk-return profiles. Under favorable conditions, their Cost Per Wallet (CPW) is extremely low, but cost volatility can be highly pronounced. For example, the Latin America region saw its CPW drop to nearly free at $0.56 in the first quarter, only to surge by 60 times to $34.38 in the third quarter, reflecting sudden liquidity constraints and demand shifts in the region. The Eastern Europe region experienced an even more astonishing spike, with CPW soaring 99 times from $0.21 to $20.79, indicating that costs can sharply rise when market conditions deteriorate.
Southeast Asia Region: Demonstrates the most stable performance across market cycles, with CPW fluctuation within a 5x range, from $3.73 in the first quarter to $16.61 in the third quarter. This stability suggests that local market factors, adoption curves, or advertiser demand may create a more predictable environment, making it a highly attractive region for brands aiming to maintain cost stability under different macro conditions, especially for projects looking to test product usage unaffected by market cycles.
The key point is that market cycles not only impact CPW but also determine when and where attracting wallet holders is truly feasible. While developed regions are highly efficient during bull markets, costs surge in bear markets. Emerging markets offer ultra-low costs but come with significant volatility. The Southeast Asia region, with its relative stability, may have the best long-term potential for brands seeking to reduce risk across different market cycles.
CPW of Top-Performing and Worst-Performing Marketing Campaigns
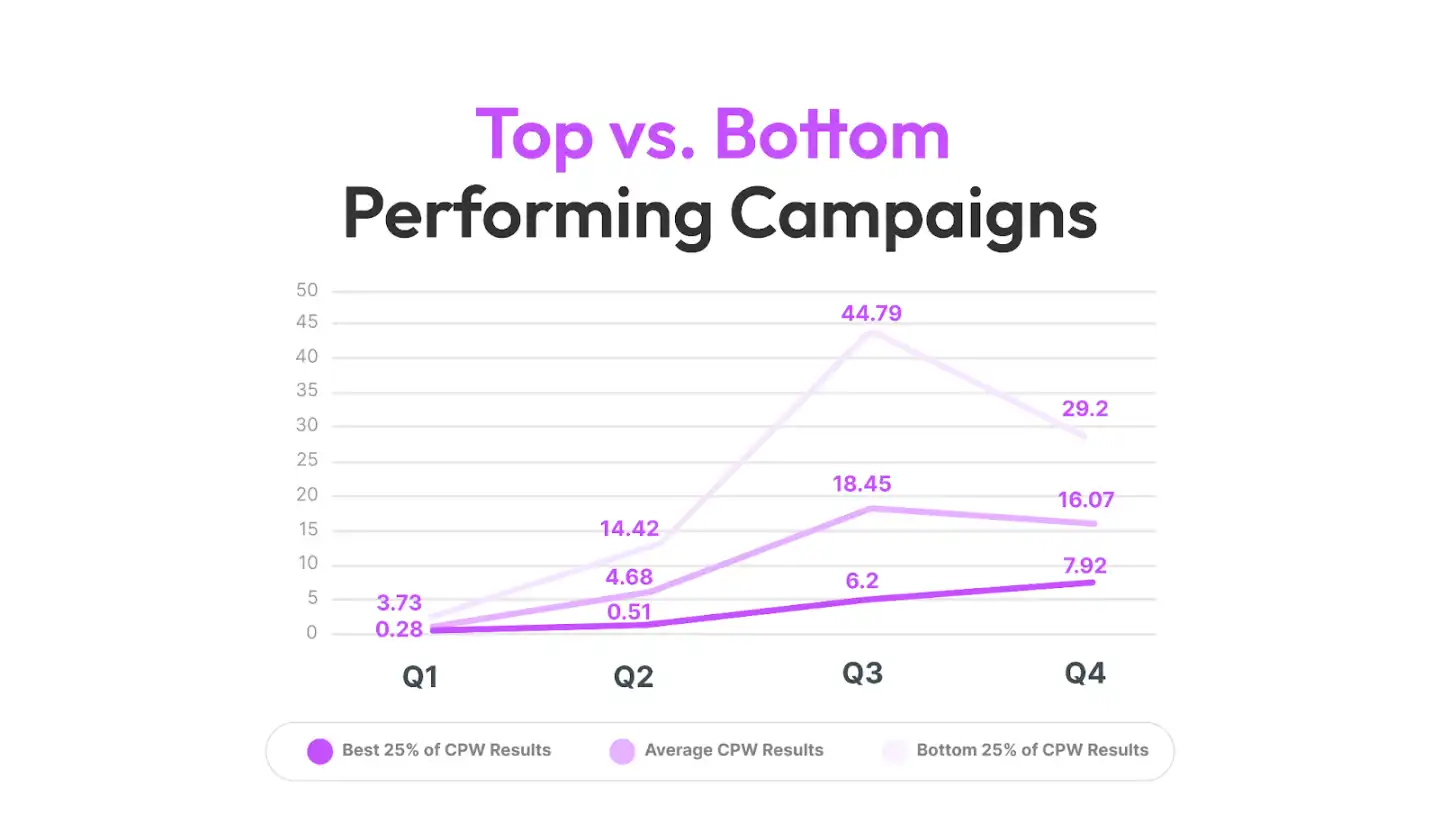
Market cycles are not the sole factor. Top-performing marketing campaigns always maintain a lower CPW, even in bearish market periods. In fact, the top 25% ranked campaigns achieve a customer acquisition cost per wallet of only $6 - $8, even in a bear market cycle, which is remarkable. Meanwhile, poorly performing campaigns see CPW fluctuate between $4.68 and $44.79.
This performance delta can be attributed to Product-Market Fit (PMF), community strength, market momentum, incentive measures, and creative execution. Campaigns that align well with their audience, have optimized messaging, regardless of market conditions, can sustain a manageable CPW.
For those trapped in high CPW marketing campaigns, shifting to low-cost regions is not the only solution. Optimizing target audience positioning, messaging, incentive measures, and creative strategies can increase efficiency, keeping CPW stable across any market.
CPW Segmented by Audience
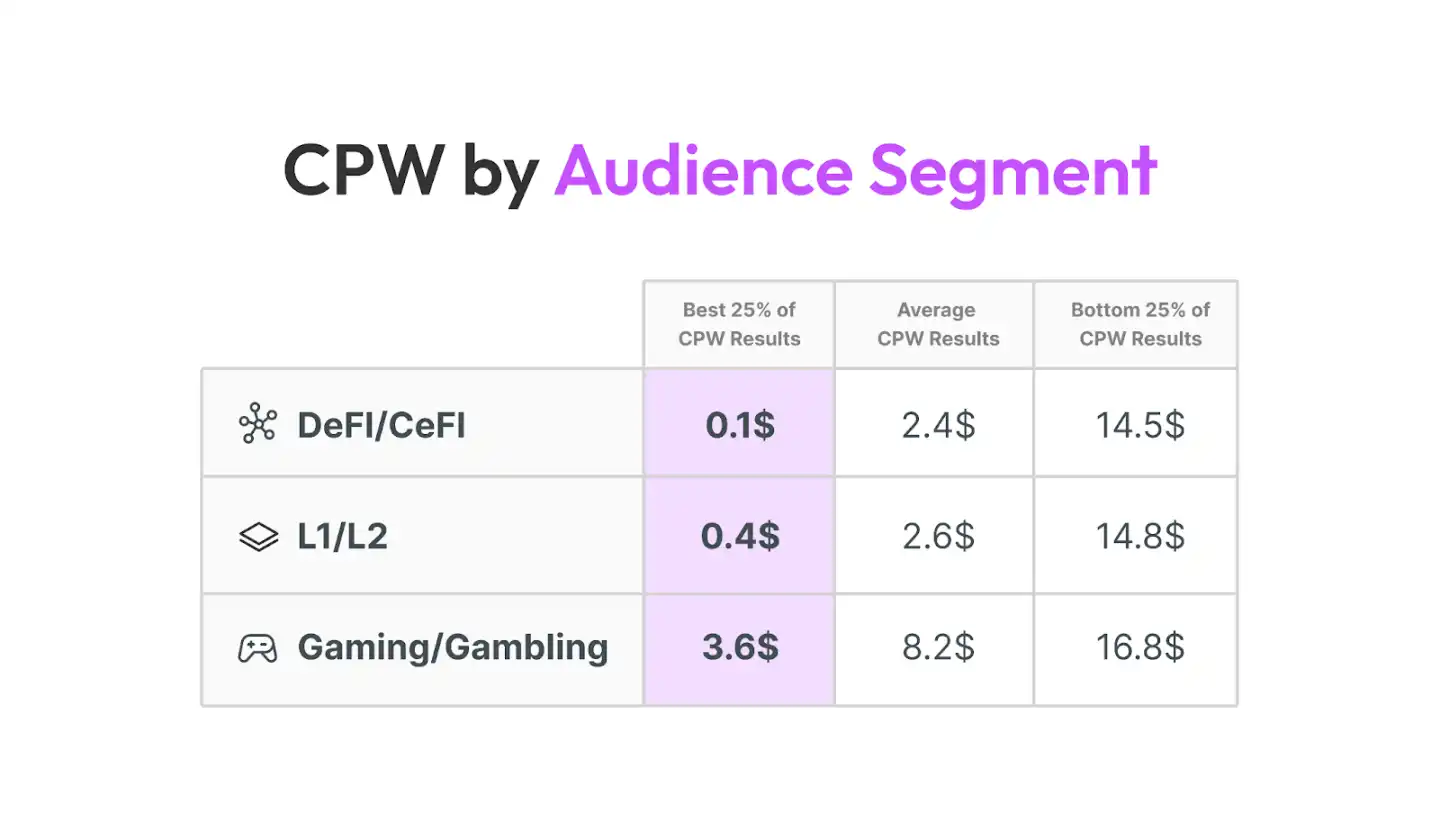
The cost efficiency of Decentralized Finance (DeFi) / Centralized Finance (CeFi) marketing campaigns is highest, with a median CPW of $2.79 and a bottom quartile of only $0.10. L1/L2 projects follow closely, with a median CPW of $3.23, reflecting their higher adoption rates.
Game and Gambling marketing campaigns have the highest cost, with a median CPW of $8.74 and a bottom quartile of $3.40, perhaps due to high user churn, frequent speculation, and intense competition. If Web3 games are indeed "unstoppable," we need to find a more robust user acquisition engine to make them sustainable, akin to Web2 games.
Conclusion: Using CPW as a Web3 Growth Framework
CPW is not solely determined by market cycles but is also influenced by the effectiveness of marketing campaign execution. The top-performing 25% of campaigns can maintain a CPW of $6 to $8 throughout the year, even during market downturns, while poorly performing campaigns see CPWs fluctuate significantly from $4.68 to $44.79. This demonstrates that market conditions are not an excuse; marketing teams that track data, optimize target audience positioning, refine messaging, and incentives are able to outperform market cycles and maintain cost-efficiency irrespective of macro trends.
This also prompts a shift in strategy when launching products. Targeting U.S. whales during a bear market is a costly gamble, leading to unsustainable CPWs. Conversely, starting from regions like Southeast Asia, which are more stable and cost-effective, allows a brand to optimize its product-market fit before expanding to developed markets. Teams that do not adopt this strategy may risk prematurely exhausting their budget before proving market demand and optimizing conversion rates.
Finally, these insights from ad-driven marketing campaigns challenge the notion that Web3 advertising "doesn't work." In fact, these results indicate that ad-driven Web3 growth is measurable, scalable, and not a dead end.
Disclaimer: The content of this article solely reflects the author's opinion and does not represent the platform in any capacity. This article is not intended to serve as a reference for making investment decisions.
You may also like
21Shares to Liquidate Two Bitcoin and Ether Futures ETFs Amid Market Downturn

The Man Who Stabbed CEO of South Korean Crypto Firm Haru Invest Could Face Decade in Prison

Meteora launches Meteora Rising incubator