Pi Network Faces Sell-Off After Mainnet Migration Deadline Ends

Pi Network's PI token experiences a 10% drop following its mainnet migration, with significant selloffs dominating the market. Despite support at $1.34, PI faces a critical crossroads in its price trend.
Pi Network’s native token, PI, slumped 10% on Friday. This double-digit decline follows widespread sell-offs following the completion of its March 14 mainnet migration.
The drop in PI’s value suggests that many holders have opted to cash out following the migration. With waning bullish sentiment, the altcoin is poised to extend this decline in the short term.
The Pi Day Downtrend Continues
The selloffs that followed the March 14 Pi Day, when the network completed its mainnet migration, have put significant downward pressure on PI’s price. At press time, the altcoin trades at $1.47, down 7% over the past 24 hours.
On the four-hour chart, PI’s falling Relative Strength Index (RSI) highlights the selling activity among market participants. It is at 38.84 at the time of writing.
 PI RSI. Source:
TradingView
PI RSI. Source:
TradingView
The RSI indicator measures an asset’s overbought and oversold market conditions. It ranges between 0 and 100, with values above 70 suggesting that the asset is overbought and due for a price decline. Converesly, values under 30 indicate that the asset is oversold and may witness a rebound.
PI’s RSI reading of 38.84 and falling suggests that selling pressure outweighs buying activity in the market. It hints at a potential continuation of the downtrend unless a reversal occurs and PI accumulation resumes.
Furthermore, its Aroon Down Line is at 92.86% at press time, signaling that PI’s current decline is strong.
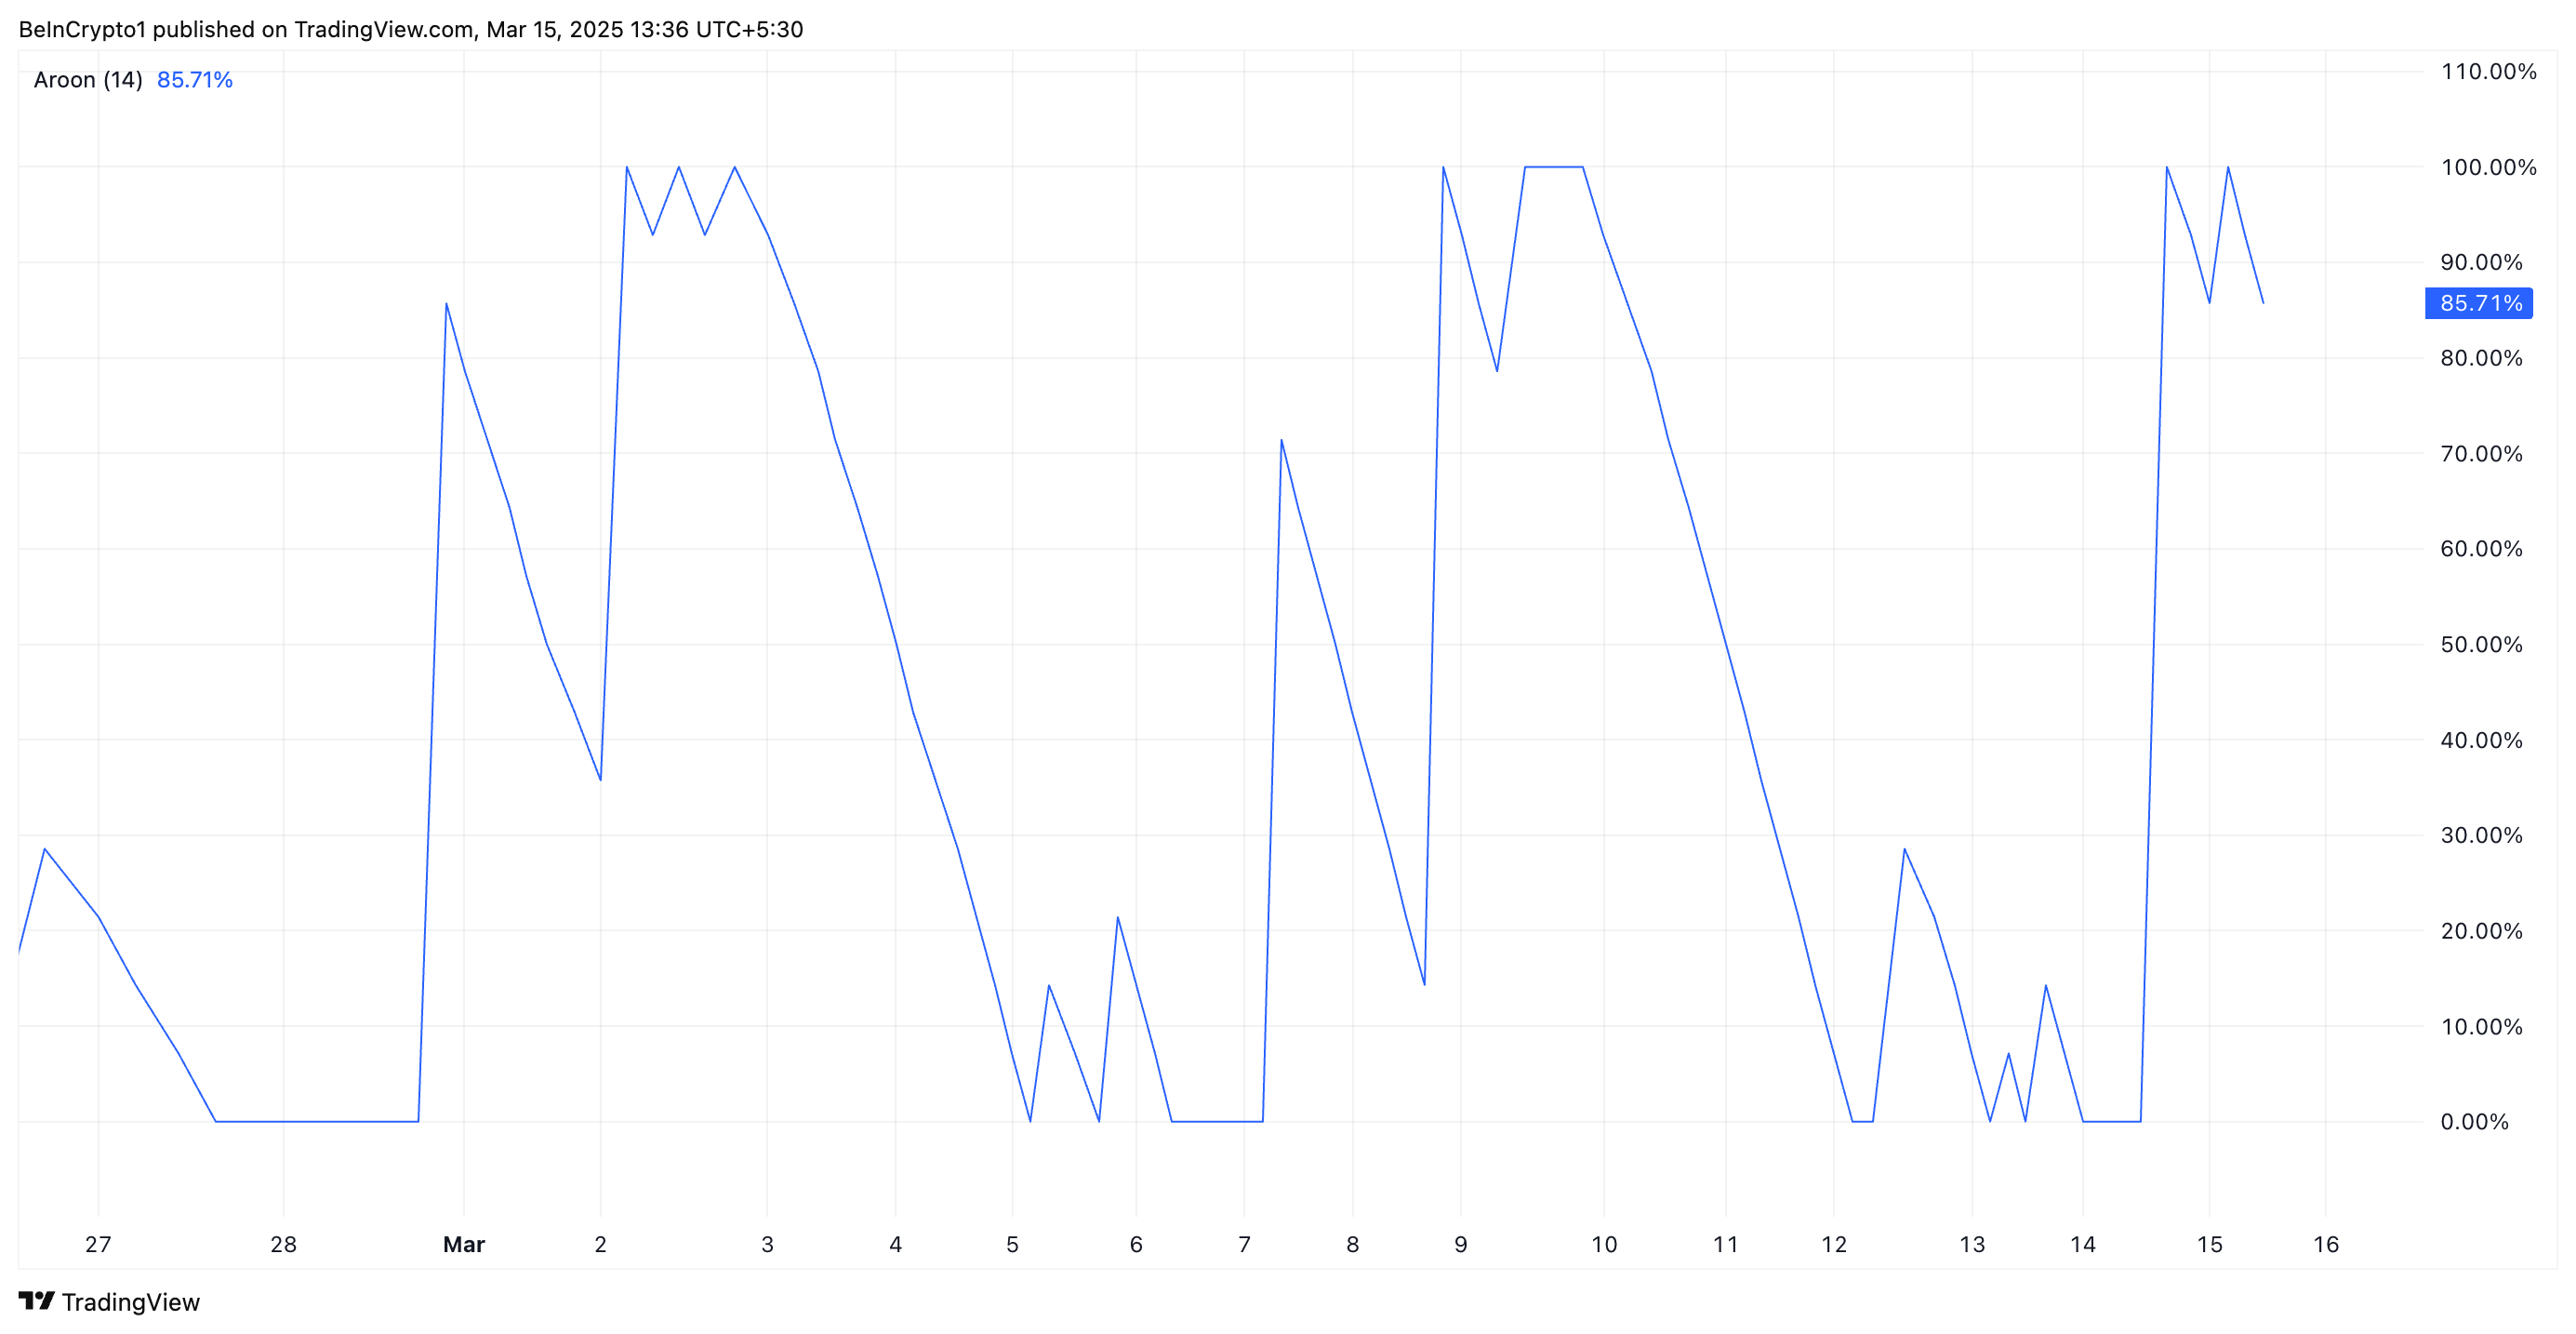 PI Aroon Indicator. Source:
TradingView
PI Aroon Indicator. Source:
TradingView
The Aroon Indicator measures the strength of an asset’s price trends. It comprises the Aroon Up and Aroon Down Lines. The Aroon Up measures the number of periods since the highest price, indicating bullish strength. In contrast, the Aroon Down measures the number of periods since the lowest price, signaling bearish strength.
When the Aroon Down line is at 100% or close, it indicates strong bearish momentum. This confirms that PI’s current dip is strong, and the selling pressure is substantial.
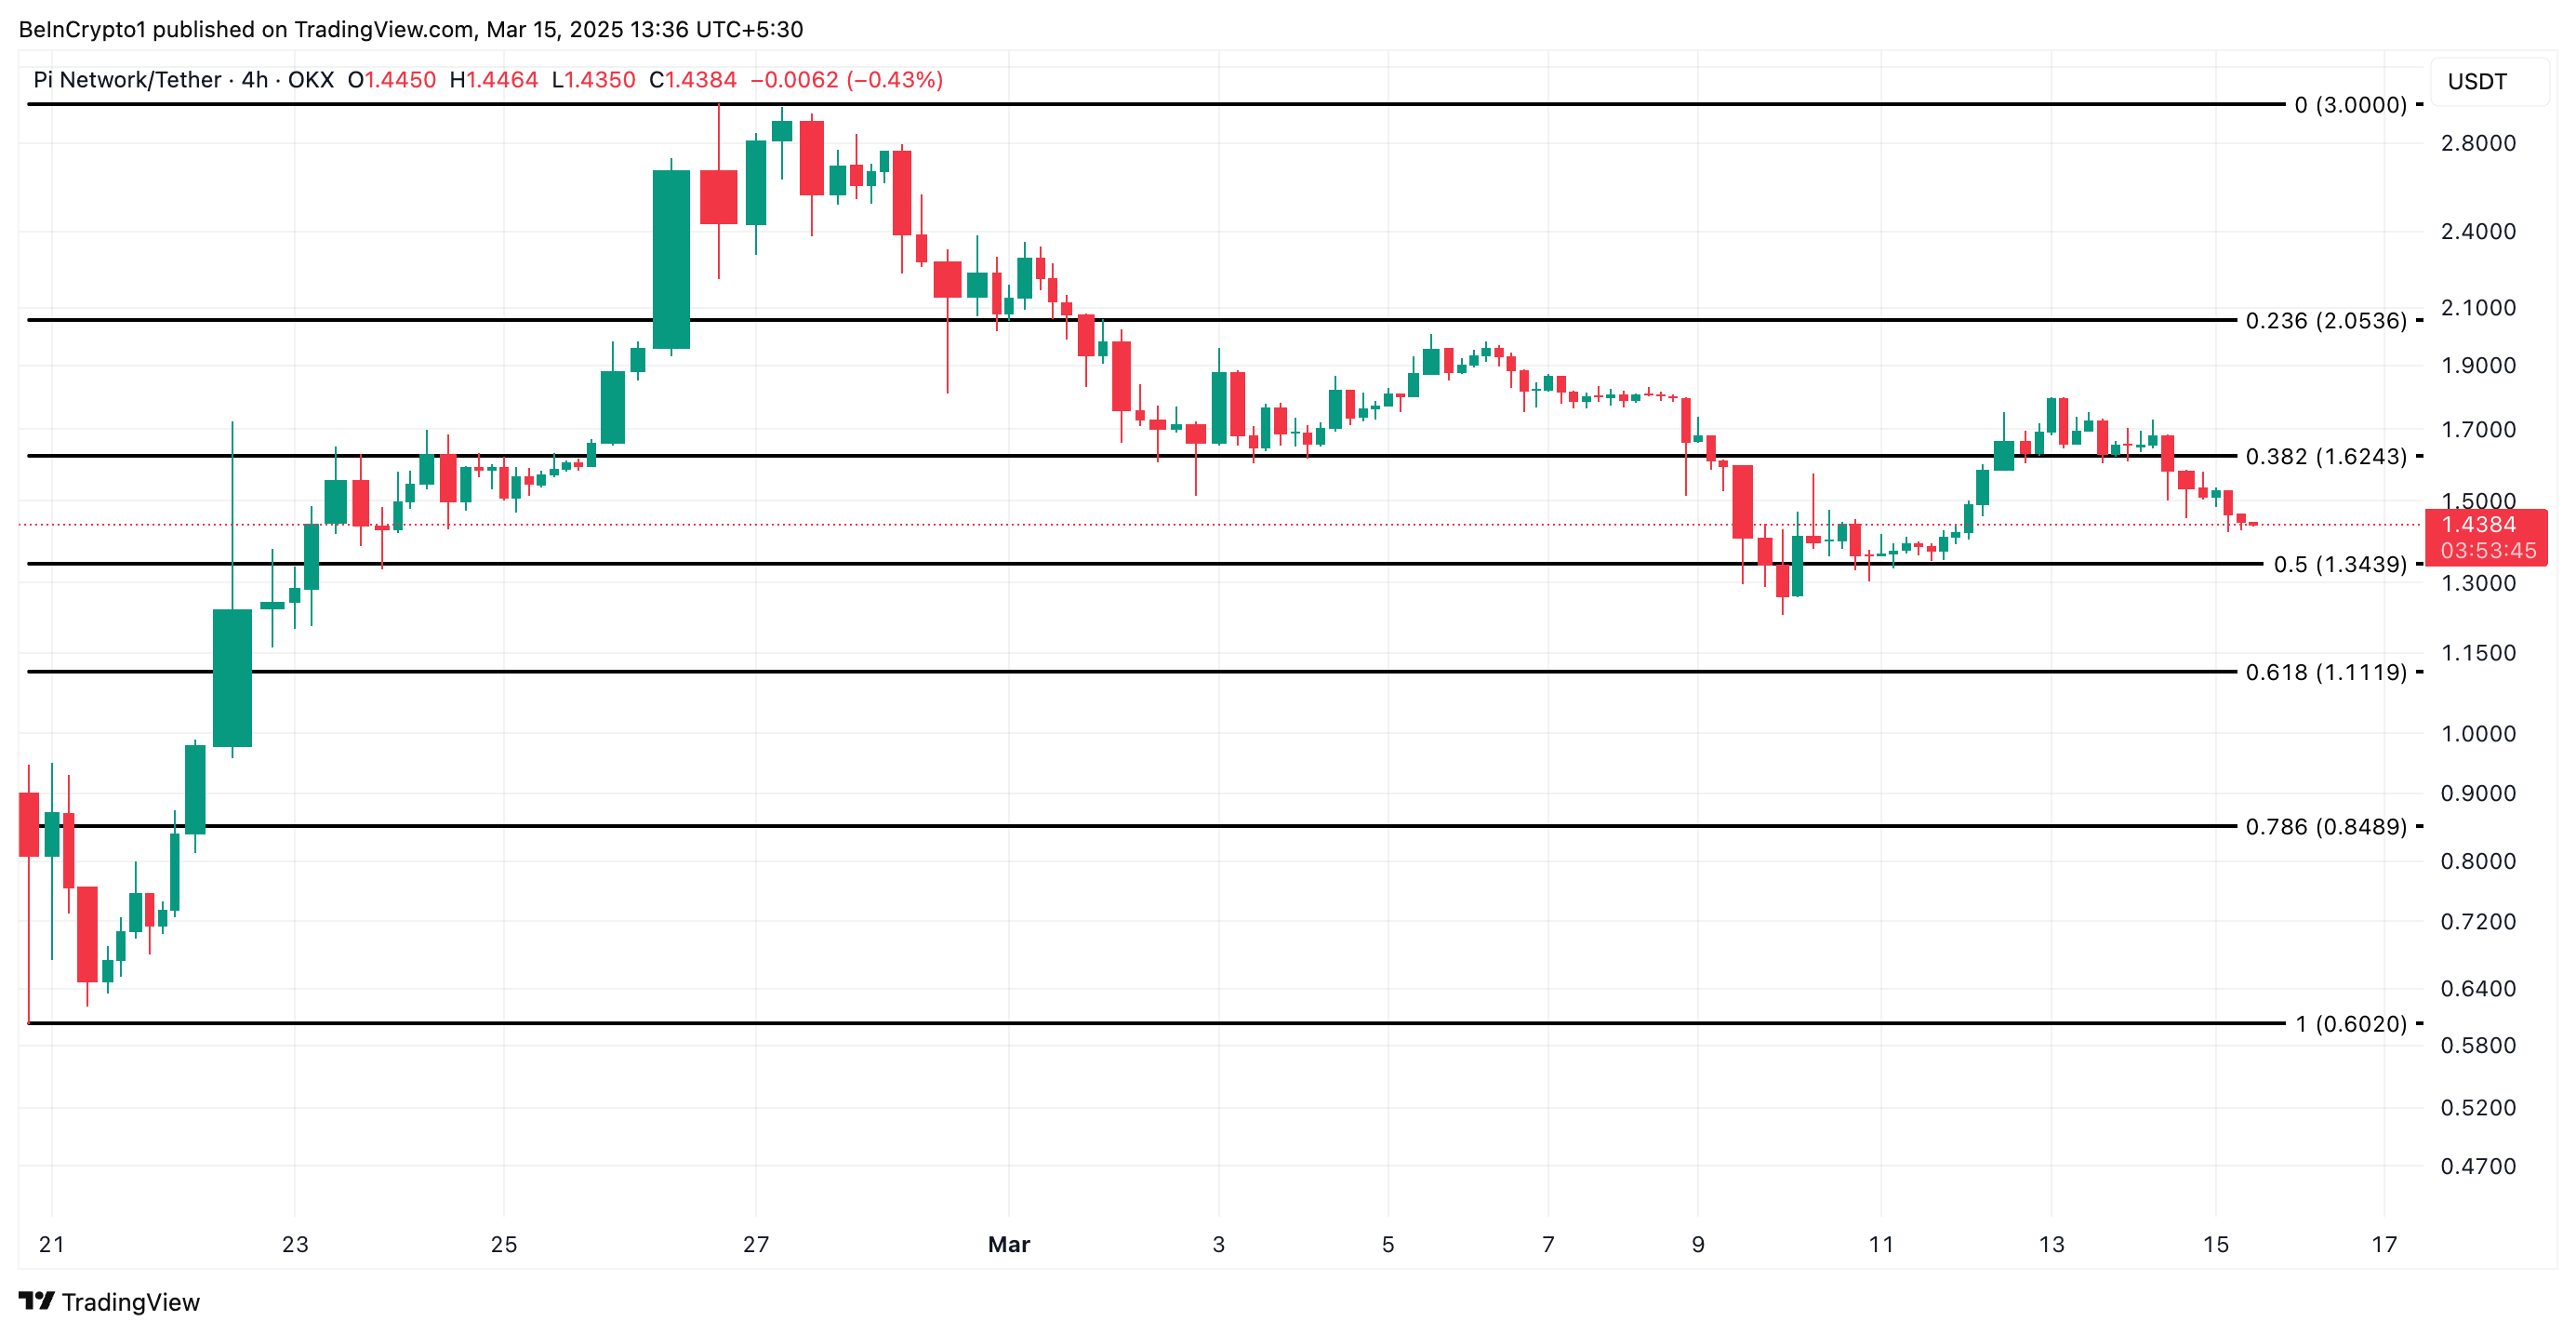
PI at a Crossroads: Can It Rebound or Slide to $1.11?
At press time, PI exchanges hands at $1.43, resting above support formed at $1.34. If buying pressure leans further, PI could break below this support floor to trade at $1.11, a low it last reached on February 11.
 PI Price Analysis. Source:
TradingView
PI Price Analysis. Source:
TradingView
On the other hand, a resurgence in PI demand would invalidate this bearish projection. In that scenario, the token’s price could breach resistance at $1.62 and climb toward $2.05.
Disclaimer: The content of this article solely reflects the author's opinion and does not represent the platform in any capacity. This article is not intended to serve as a reference for making investment decisions.
You may also like
Unwavering Bitcoin Holders Stay Put: What this Means for BTC’s Future
Exploring the Impact: The Standoff Between Long-Term Bitcoin Holders and Short-Term Sellers

Bitcoin Gains as Ethereum ETFs Lose $760M: What’s Causing the Investor Alarm?
Exploring the Shift in Investor Sentiment and Strategies Amid Surging Bitcoin Popularity and Ethereum ETFs Divestment

Tether Eyes Big Four Audit as Trump Urges Stablecoin Regulations, Reuters Reports
Acting SEC Chair Rejects Enforcement—Demands Real Crypto Rules